

Greetings From UCLA ECE 202A Healthy Alexa
Get Fit Today
Presented by:
Hannaneh Hojaiji
Ahmed Refai

Introduction and Problem Statement
Wearable devices are quickly becoming a ubiquitous part of the IoT environment. Smart watches such as the Hexiwear collect many different metrics such as heart rate, acceleration, orientation, number of steps, humidity, temperature, and pressure. This data, when processed appropriately provides the user with valuable insights into the way they live their lives. We plan to integrate the Hexiwear with Amazon Echo’s Alexa and enable the user to ask Alexa questions such as “What was my average heart rate over the last hour?” or “How active was I yesterday?” through developing Alexa Skills and possibly a mobile application interface. More specifically, this system can be adapted as a personal trainer or a fitness pal to analyze the collected workout information and provide feedback to the user. Data will be collected from the Hexiwear and transferred to a [Computer/Mobile device] which stores the data in a database on the cloud. A RESTful API will allow Alexa or a mobile device to query the database for the data and present it to the user when prompted.

Prior Work
Chunara et al. discuss how to track health-seeking behaviors and measure public and private sector facility utilization during an Ebola outbreak via mobile phones and short messaging service (SMS) [1]. Additionally, as Emaminejad et al. elaborate in a recent Nature publication, wearable sensor technologies are essential to the realization of personalized medicine through continuously monitoring an individual’s state of health [2]. There is a need to combine these sensors along with artificial intelligence means available to people on the day to day basis to start a future revolution in connecting homes and hospitals for better health monitoring applications.
Technical Approach, Experimental
Methods & Analysis
Coding and Data Collection: Hexiwear
-
Libraries Used:
-
HTU21D for the temperature and humidity (htu21d also existed, but the sensor reading results were not correct, also MPL3115A2)
-
FXAS21002 for Gyro
-
FXOS8700 the accelerometer and magnetometer, but we used accelerometer only.
-
Since the gyro and the accelerometer are hooked to the same pins, we learned somethings about the coding. Each of these modules needs to configured and read in order, but also it was important to directly use the storage array for the raw values of the X, Y and Z axes. As we tried to store the 6 values for the 2 sensors in global variables, the values for the accelerometer were always zero, and when we put the gyro and accelerometer values to be reported serially in the order that the chips were configured, we were able to get 5 values correctly, but still ax was zero, when we replaced the global variables with the arrays used to store the raw values, the problem was resolved.
-
It was also important to not refrain from updating the MbedOS for the newer version. When the OS was updated any of the codes developed by Mbed, or the one that I worked on, did not work on the Hexiwear, and the outcome was a blinking red LED in the bottom of the screen.
-
However, with the previous OS retrieved from the past project, all the codes run smoothly and the OLED screen shows the images smoothly [3-13]
Coding and Data Collection: Hexiwear
-
Hexi_OLED_SSD1351 for the Oled to present the graphics we had implemented through the mapping of the OLED matrix and defining the pixel colors to get the graphics you want
-
Hexi_KW40Z the library for the Bluetooth chip
-
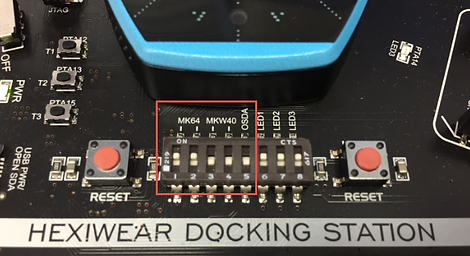
The DIP pins were out of order to enable programming the two MCUs for MKW40 and MK64 , so the Bluetooth chip was not working and the expected blinking effect where the "left key" not being activated on this Hexiwear. Tried these tricks to program the MCUs again, but the KW40 was stuck in the Maintenance mode with the 1111 or 0011 combinations. However, the 1101 combination that the device was set for did work correctly and let us collect results serially [14, 15].
-
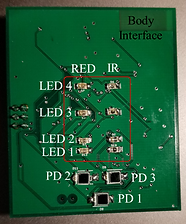
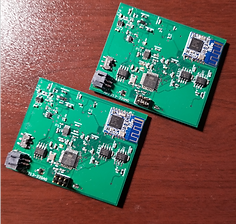
Additionally, two extra boards were developed to help us measure PPG at different points on the body and enable a more advanced application of using several sensor networks on the body used in our intelligent Alexa system (figure 1).
A)
B)
Figure 1. A) Positioning of LEDs and Phtodetectors Based on Findings from Papers. B) The Boards Fabricated for Complementing Body Sensor Network with Hexiwear
PPG and Tissue Oxygenation Board Development &
Data Collection and Processing
-
MAX30101 the chip used for heart rate and PPG readings. The library developed by the Maxim integrated was not very well developed. Trough one Mbed source code the working library was implemented. However, the readings are not appealing (figure 2).
-
The heart rate sensor on the Hexiwear was interesting enough for me to try to make the sensor myself and improve it further since by looking at the data and the drift, I am not satisfying that this sensor is reaching its full potential. Curious about the fact that some smartwatches use the green light, but some use the red light was a bugging question. Additionally, being constrained to put the device tightly on hand to perform the measurements and with the readings to be very different, there is a potential to develop a wearable system to not only measure the blood oxygenation, but also to measure the tissue oxygenation, and with future directions that we will introduce, it can be made into a smart system to detect were on the body it is placed and adjust the measurements.
-
PPG (photoplethysmogram) - uses optical sensors to measure changes in volume within an organ or whole body [16, 17] (figure 1A).
-
Modified Beer-Lambert’s law helped calculating light attenuation (A) which accounts for scattering (G) But given that scattering remains constant, we can eliminate G by using different light attenuation (aka optical densities) and subtracting to find the difference.
-
LEDs are placed at distances away from the photodetector to measure different depths in the tissue. Then, light is shined towards the blood vessel and photodetector looks at a light intensity from blood vessel: “Light from the diode enters the tissue, is reflected by deeper structures, and 'backlights' superficial blood vessels. Then, as superficial blood vessels fill with more blood, they absorb more light returning from the deeper tissues, and photodetector light intensity diminishes” [18].
-
“Of the two or more wavelengths measured by the pulse oximeter, traditionally only the infrared signal (approximately 940 nm) is presented. The information from this wavelength is displayed because it is more stable over time, especially when compared to the red signal (660 nm), which is more susceptible to changes in the oxygen saturation.” [19]
-
“The shorter wavelengths of light are strongly absorbed by melanin. Water absorbs light in the ultraviolet and longer IR regime; however, red and near-IR light pass easily.” -- most absorption occurs in blue region [20]
-
Green-yellow (500-600 nm) - good for superficial blood flow, “exhibits large modulation depth”, “A green LED has much greater absorptivity for both oxyhemoglobin and deoxyhemoglobin compared to infrared light.” (but also green light is easily absorbed by body) (figure 3).
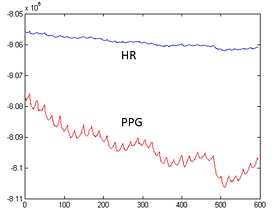
Figure 2. Results of MAX30101.
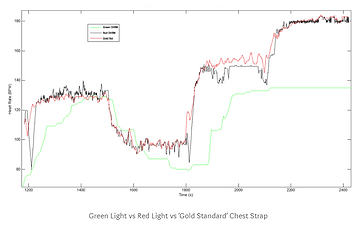
Figure 3. Results of PPG Measurements with Red Light (Red), Green Light (Green), and a Standard Chest Strap (Black) [21].
PPG and Tissue Oxygenation Board Development &
Data Collection and Processing
- “Hemoglobin absorbs green light better than red and green light penetrates tissue to a deeper level than blue light”
-
Red-near-infrared (650 - 1100 nm) - good for deep tissue blood flow, transparent to melanin [21]
-
The most suitable LED wavelengths will be in the range between 650nm- 700nm
(minimal absorption of HbO2) and 850nm – 930nm (minimal absorption of HHb) (figure 4). -
There are two models to measure PPG:
-
Transmissive (through the finger)
-
Reflective
-
PPG sensors
-
“use electrical signals derived from light reflected due to changes in blood flow” [23]
-
“require a relatively long settling time due to the need for measuring the amount of ambient light and calculating the compensation needed for canceling its effect.”
-
“may also require compensation of motion artifacts to produce a reading,” so employing signal processing techniques such is a 5th order low pass filter, moving average, and denoising with multiple photodetector readings helped me with getting clean output signals (figures 5, 6). It is also important to measure the signal on areas with maximal PPG signals (figure 7).
-
-
AC & DC components of the readings represent the following:
-
AC - pulsating component based on pulse
-
DC - static component created “mostly by the absorption of light by surrounding tissue”, then an auto-centering algorithm is used to eliminate this (figure 8).
-
-
Additionally, to confirm the readings, we found that research on reflection PPG to measure blood flow changes in human patellar bone (31) shows a linear correlation between change in pulsatile pressure & change in PPG signal.
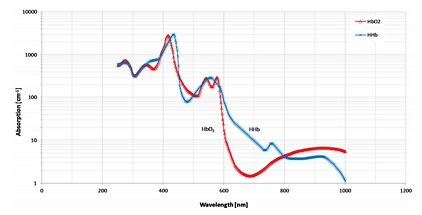
Figure 4. Optical Properties of Hemoglobin and Deoxygenated Hemoglobin Compared to LEDs [17, 22].
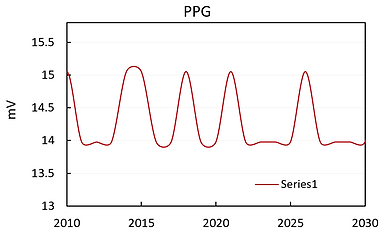
Figure 5. Results Obtained by the Board.
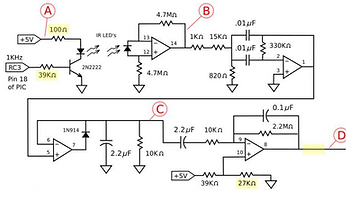
Figure 6. Representative Circuit Diagram [25].
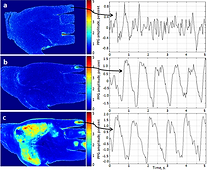
Figure 7. Representation of PPG Signal Amplitudes [26].
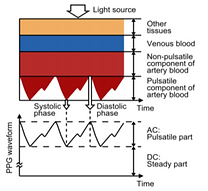
Figure 8. AC and DC components of PPG and the Skin Layers[24].
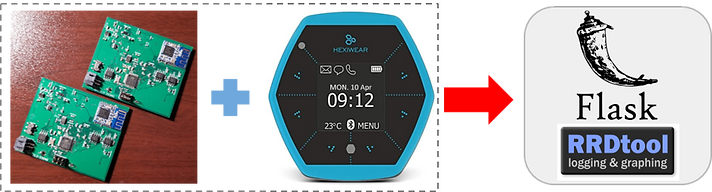
AWS & Backend + Data Storage
-
AWS provides services to deploy and test Alexa skills. The Alexa Developer Console allows for the development of a speech model. The speech model is a JSON file with “sample utterances” for each intent. For example, the intent to ask Alexa about your temperature would expect something similar to “{What was} my average {temperature} {yesterday}?” An utterance from this project consists of a “What Phrase”, a “parameter”, and a “time”. To account for the variations in how different users would ask for the same thing.
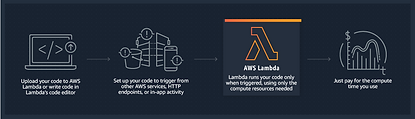
The backend for the Alexa skill consisted of two parts. First, an AWS lambda function operating on a NodeJS runtime handles the intents highlighted in the Speech Model JSON. It handles the flow of the alexa skill. In our implementation, it is handled as a state machine with 2 states, each consisting of several sub-states. The two main states are “search” and “description”. From those two modes, the lambda function will either search for what alexa has just listened for, or instruct alexa to describe the result of the search. The second part of the backend is a Python Flask backend. The lambda function leverages Node’s request library to make http requests to a remote API connected to the flask backend. The API is in charge of interfacing with our database tool of choice, rrdtool.
RRDTool allows the storage and rapid access of time series data, as is common in an IoT setting. RRTool also allows for the archival of old data through different functions such as AVERAGE, MIN, and MAX, among others. This not only saves space on limited hardware resources, but also allows for insightful data representation. For example, storing the daily average temperature of a user, or storing the average hourly activity of a user, and having them available for quick access through a simple API call without the need for additional processing. Thereby eliminating significant overhead. [27-30]
AWS & Backend + Data Storage
-
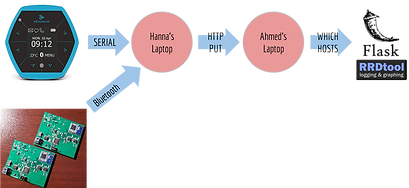
Flask App Architecture: Due to difficulties with the Hexiwear’s bluetooth and the raspberry pi’s and my laptop’s serial interface we had to change path data took to reach the RRD.
The intended architecture was for the Hexiwear to communicate with the RbPi over bluetooth and for the RRD and Flask app to be hosted on the Raspberry Pi. In a perfect world, this would have been our implementation. Instead, or system looks like this:
-
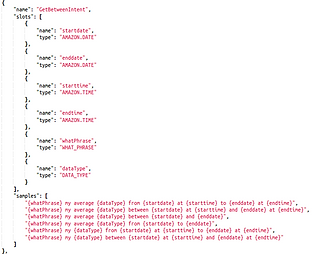
Interaction Model - You can edit this on the Amazon Developer Console.
-
The user’s voice commands are processed and matched with one of the samples provided in the interaction model json file. The corresponding intent is then called on the AWS Lambda function.
-
Data types are known as slots. Amazon defines preset slots such as AMAZON.DATE and AMAZON.TIME.
-
You can also define custom slots to fit your needs.
-
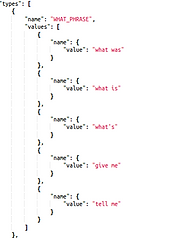
Custom slots - known as “types”.
-
For example “WHAT_PHRASE” attempts to cover all the different way a user may ask for information.
-
“DATA_TYPE” covers readings a user may ask for such as “temperature”, “humidity”, etc.
-
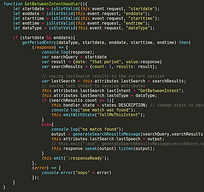
The AWS Lambda consists of handlers, speech message generators, and a Javascript Intents object, along with several helper functions for modularity and readability.
-
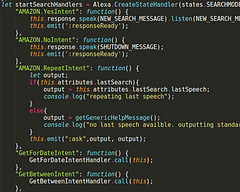
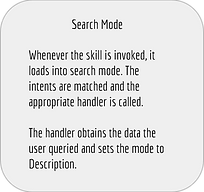
Search Mode: Along with the default intent handlers provided by amazon, we implement the GetForDate and GetBetween intents, with “this” context passed in. In the handlers, the input arguments are checked for validity. Then an asynchronous HTTP Get Request is sent to the Flask Backend. The response is stored in the context object space, and we invoke the Description state and emit the “TellMeThis” intent.
-
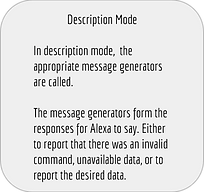
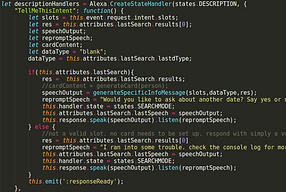
Description Mode: In Description mode, the “TellMeThis” intent handler takes the response from the context object (this.attributes.lastSearch...) and generates the message for Alexa to say. State is set back to Search mode and Alexa is instructed to say the response.
-
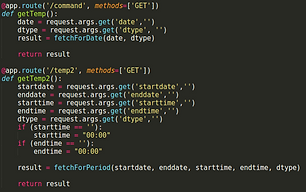
Flask App and RRDTool: Each intent handler in the Lambda is connected to a route on the flask app. The Flask app distils the input and passes it into functions who process the query, make the query, and process the result. The app then it returns the result to the Lambda. We have written a Python API to interact with the database through scripts instead of the expected command line invocations.

-
RRDTool: RRDTool, which stands for Round Robin Database tool, allows for efficient storage and retrieval of time series data.
-
Once installed, the database can be interacted with through the command line. There are API’s available in languages such as Perl, but the python libraries have fallen into disuse and no longer work. For this reason, I made my own library to interact with the database tool.
-
For the purposes of this project, even though RRDtool is much more powerful and capable of so much more, I only wrote the functions that I needed. For this reason, it is only a partial API that does not take advantage some features including graphing.
-
The tool allows you to create RRD “tables” using the “rrdcreate” command. The create command takes in the following:
-
Name, start time, datasources, archives, and an optional step parameter.
-
-
The command to update readings is “rrdupdate” and takes in the following:
-
Name, time, value
-
-
The query command is “rrdfetch” and takes in the following:
-
Name, consolidation function, start, end, and resolution
-
-
I have implemented versions of these in the API
-
rrdCreate data sources: “DS:type:heartbeat:vmin:vmax”
-
DS -> defines that this string going to be declaring a data source.
-
Type -> Many different options {COUNTER, GAUGE, DERIVE, ABSOLUTE …}, for this project, all our sensors were gauges.
-
heartbeat -> The maximum amount of time between two readings before the sensor reading goes to “unknown”
-
vmin - vmax -> These values allow for sanity checks of the data. If defined, rrdtool will throw a warning if values fall outside these ranges.
-
-
rrdCreate archives: “RRA:cf:xff:step:rows”
-
RRA -> defines that this string declares an archive
-
cf -> consolidation function. How the archives consolidate the data that is stored in the archives.
-
xff -> defines what part of a consolidation interval may be made up from “unknown” data before it is considered unknown
-
step -> how many readings to grab and place in the archive as one point
-
rows -> how many entries the archive will contain
-
-
rrdUpdate: This takes in the name of the “table” to update, and a tuple of (timestamp, value).
-
For use when entering data read straight from the sensors
-
timestamp -> UTC timestamp of the current time (or whatever time the data was read)
-
value -> value of the current sensor reading.
-
-
rrdBatchUpdate: Takes in the name of the table and an array of (timestamp, value) tuples.
-
For use when entering data in retrospect from a file.
-
Greatly speeds up the input of bulk data into the RRD by inputting multiple readings in a single command.
-
Theoretically only limited by the maximum allowed length of the command line, (OS dependent, typically hundreds of thousands of characters).
-
-
rrdFetch: takes in the name of the RRD, a consolidation function, start time, end time, and optional resolution.
-
Will return all data stored in the RRD between the start time and the end time. The resolution parameter is useful if you would like a coarser view of the data. Such as “I want one sample from every minute, rather than every second.”
-
-
We declared 5 RRD for each of the sensor types we are collecting (temperature, humidity, accelerometer, gyroscope, and ppg)
-
After obtaining data from the hexiwear for standing still, walking, and running, we randomly stitched together 10 days worth of data that mimicked a user who was three times a likely to be standing still than they were to be walking, and twice as likely to be walking than they were to be running.
-
The sensor readings were read from the file and batch updated into the RRD, one reading per second. For everything but the ppg readings, the RRAs were set to average readings every hour, and store those archives for 10 days. Instead of an AVERAGE consolidation function for PPG readings, we used a MAX cf because we were more concerned with the peak PPG readings. Accelerometer and Gyroscope readings were stored as magnitudes instead of separate x, y, z values.
Demo & Results
Future Directions
-
Develope multi-user and multi-device access on the server
-
Develop security measures and authentication
-
Implementing machine learning algorithms to improve activity detection
-
Investigate and improve more activities
References
-
Feng, S., Grépin, K. A. & Chunara, R. Tracking health seeking behavior during an Ebola outbreak via mobile phones and sms. npj Digital Medicine https://doi.org/10.1038/s41746-018-0055-z.
-
Gao, Wei, et al. "Fully integrated wearable sensor arrays for multiplexed in situ perspiration analysis." Nature 529.7587 (2016): 509.
-
Mbed, https://docs.zephyrproject.org/1.10.0/boards/arm/hexiwear_k64/doc/hexiwear_k64.html
-
Mbed, https://os.mbed.com/users/DimiterK/code/Hexi_MAX30101/diff/2e1700fc3386/main.cpp/
-
Mbed, https://os.mbed.com/teams/Hexiwear/code/Hexi_Click_AirQuality_Example/
-
Mbed, https://os.mbed.com/teams/Hexiwear/code/Hexi_Gyro-v2_Example/
-
Mbed, https://os.mbed.com/teams/Hexiwear/code/Hexi_Accelero-v2_Example/
-
Mbed, https://os.mbed.com/teams/Hexiwear/code/Hexi_Humid_Temp-v2_Example/
-
Mbed, https://os.mbed.com/teams/Hexiwear/code/Hexi_BLE_Example/
-
WolkSense, https://github.com/Wolkabout/WolkSense-Hexiwear-/tree/5e6330db8fefd5e3eda8bd212b0bd056d88cc83e
-
NXP, https://www.nxp.com/docs/en/user-guide/MKW40ZSMACSW303QSG.pdf
-
https://mcuoneclipse.com/2016/12/07/flashing-and-restoring-the-hexiwear-firmware/
-
https://docs.zerynth.com/latest/official/board.zerynth.hexiwear/docs/index.html
-
https://www.amperordirect.com/pc/help-pulse-oximeter/z-what-is-oximeter-plethysmograph.html
-
Kostic, "Development and Testing of a Portable Multi-Channel Depth-Resolved Near-Infrared Spectroscopy System for Lower Leg Tissue Oxygenation Monitoring". UCLA. 2013
-
Reisner, Andrew, et al. "Utility of the photoplethysmogram in circulatory monitoring." Anesthesiology: The Journal of the American Society of Anesthesiologists 108.5 (2008): 950-958.
-
Shelley, Kirk H. "Photoplethysmography: beyond the calculation of arterial oxygen saturation and heart rate." Anesthesia & Analgesia 105.6 (2007): S31-S36.
-
Tamura, Toshiyo, et al. "Wearable photoplethysmographic sensors—past and present." Electronics 3.2 (2014): 282-302.
-
BSX Technologies, https://medium.com/bsxtechnologies/red-light-versus-green-light-74fdd5fe7027
-
Scheeren, T. W. L., P. Schober, and L. A. Schwarte. "Monitoring tissue oxygenation by near infrared spectroscopy (NIRS): background and current applications." Journal of clinical monitoring and computing 26.4 (2012): 279-287.
-
http://neurosky.com/2015/01/ecg-vs-ppg-for-heart-rate-monitoring-which-is-best/
-
Näslund, Jan, et al. "Non-invasive continuous estimation of blood flow changes in human patellar bone." Medical and Biological Engineering and Computing 44.6 (2006): 501-509.
-
Kamshilin, Alexei A., et al. "A new look at the essence of the imaging photoplethysmography." Scientific reports 5 (2015): 10494.
-
Aws lambda docs: https://aws.amazon.com/lambda/resources/
-
RRD tool docs: https://oss.oetiker.ch/rrdtool/doc/index.en.html
-
Alexa Skills tutorial: https://github.com/alexa/skill-sample-nodejs-team-lookup/blob/master/instructions/1-voice-user-interface.md
-
Python Flask Docs: http://flask.pocoo.org/docs/1.0/